
OK, pointless project alert but I wanted something to have a play with and more specifically something I could do to have a play with TSI (Time Series Insights) – just one of Azure’s many, many data services and one that is specifically designed for ingesting and visualising time series data generated by IoT devices. So, we have the data ingestion and visualisation tool but what to ingest? I expanded my geeky gadgets over the Black Friday weekend and purchased the Tado Radiator Valves to go along with my Tado heating system (a fantastic system and well worth a look if you’re in the market for smart heating) so I decided to use those. Although you cannot query these devices (as far as I can see) locally you can pull the data using the Tado API from their cloud service. Perfect. I couldn’t specifically find anything in the documentation that disallowed this but do your own research.
One of the (many) reasons this is a pointless project is Tado do already have a fantastic app & visualisations – but it’s far more fun to play yourself.
What are we going to deploy?
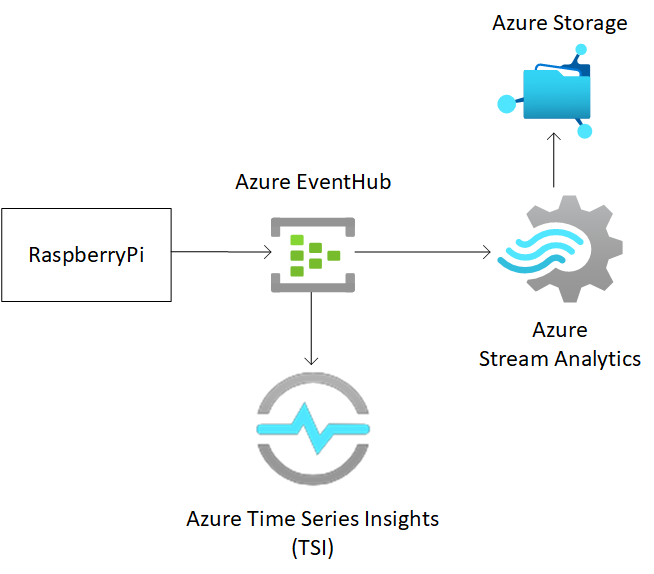
We’re going to use an Azure EventHub to ingest the messages being sent from the RaspberryPi which will inturn be a data source for a Time Series Ingsights instance. The EventHub will also serve as the input object for a Stream Analytics Service before being output into a Azure Storage Account.
On the RaspberryPi we’re going to use a Docker container to run Python code that will pull data from the Tado API to get the temperature of my room. I could of course run this from anywhere with Docker but I have a RaspberryPi I use for just this kind of playing.
Getting the Data from the Tado API
For this, I decided to expand my playing a little more and to use a RaspberryPi device which is another reason this is a pointless project – there are far easier ways this could have been done but I also wanted to have another play with IoT Edge and specifically creating a Docker container and pushing the container to a IoT device (the Pi in my case).
The Python Code
First off – I’m not a Python developer, just a dabbler – there are likely there will be far better, more efficient, and effective ways of writing this Python.
You can find the code on my GitHub - here
There is no official support nor documentation around how to use the API but with a little playing around I have managed to come up with this API call that will pull the temperature from my office radiator:
response = requests.get("https://my.tado.com/api/v2/homes/MYHOMEID/zones/5/state?username=MYUSERNAME&password=MYPASSWORD")
I am looping this every 15 seconds so as not to over call the API and also the temperature in the room isn’t going to fluctuate quickly.
In addition to pulling the actual room temperature you will notice I have also randomly generated two numbers – I’m doing this to make the TSI visuals more interesting, and allows me to play with multiple data variables within TSI coming from the data source.
r = random.randint(1,100)
a = random.randint(1,1000)
I am then generating a string that I will convert into the JSON object. like this:
json_obj = {“deviceID”:“1234567890”,“temp”:r,“airquality”:a,“actual”:t,“timestamp”:currenttime}
You will notice I’m providing:
- A deviceID as a string value (more on that below)
- ‘temp’ and ‘airquality’ as the randomly generated integers
- ‘actual’ that is the returned value of my Office radiator from the Tado API call
- A time stamp which will be used by TSI.
Setting up the EventHub
You will notice from the Python code I’m using a EventHub to pass the data into Azure.
producer = EventHubProducerClient.from_connection_string("Endpoint=sb://MYEVENTHUB.servicebus.windows.net/;SharedAccessKeyName=tado;SharedAccessKey=MYKEY=;EntityPath=tadohub", eventhub_name="tadohub")
I did originally set this up as the free pricing tier, but this only allows a single consumer group which wasn’t going to work with the Streaming Analytics and TSI service – see Setting Up Time Series Insights (TSI) below.
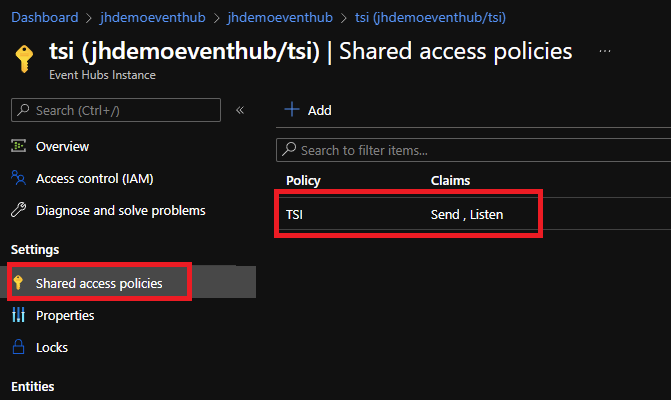
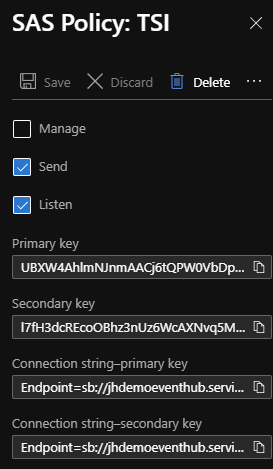
Everything is pretty much out of the box for the Event Hub, you will just need create a Shared Access Policy with TSI just needing Listen permissions and copy over the connection string into the Python file from earlier.
Once you have this setup you just need to grab the connection string and use this in the Python code. You just need to update this line with your connection string and eventhub name:
producer = EventHubProducerClient.from_connection_string(“YOUR CONNECTION STRING”, eventhub_name=“YOU REVENTHUB NAME”)
Creating the Docker container
Now that I have my .py file and have updated it with the correct Event Hub connection string I can create my Docker container based on the official Python image from the Docker Hub. I’m using the Buster image ‘python:3.10.1-buster’ and am using pip3 to install the necessary packages. It’s worth noting here this needs to be running under Python 3 – Python 2 will not work.
My Dockerfile looks like this:
FROM python:3.10.1-buster
WORKDIR /usr/src/app
COPY tado.py .
RUN apt update
RUN apt install -y cmake
RUN apt install -y libxml2-dev libz-dev python-dev python3-dev build-essential
RUN pip3 install uamqp==1.5.1
RUN pip3 install nest-asyncio
RUN pip3 install azure-eventhub
CMD [ "python3", "./tado.py" ]
I’m not going to go into how to create the Docker container in this post; I have another post here that goes into the basics of creating a container for the first time.
Setting up Time Series Insights (TSI)
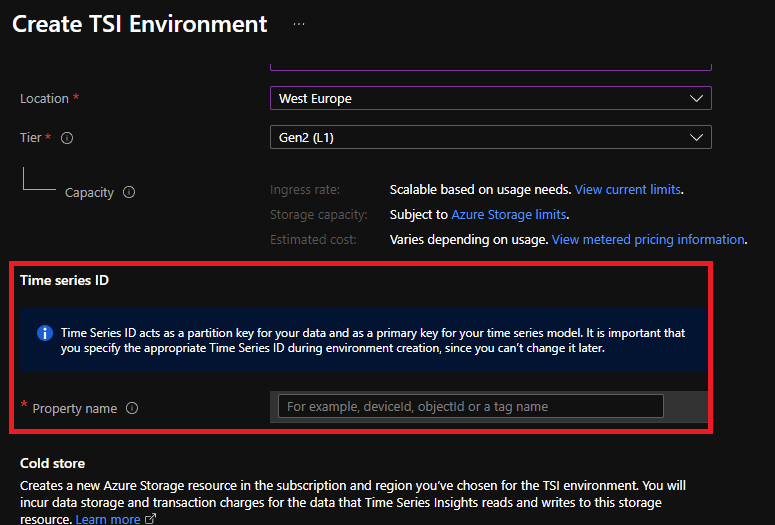
Device ID
The Device ID in TSI is used as the partition key for your data and as a primary key for your time series model. In my instance I am using a number that represents my RaspberryPi. As I’m only using one device understanding where the data has come from is simple, if you’re using this in production with hundreds or thousands of devices being able to use a primary key to understand the data is critical. It’s important to get this right as you cannot change the Time Series ID later.
It’s worth noting this IS case sensitive. In the Python I had it set to DeviceId and TSI’s Time Series ID Property was set to DeviceID, this meant that the data was initially only showing up under null. As soon as I updated the Python to DeviceID all started working as expected and the Pi device showed up as its own instance.
TSI Concumer Group
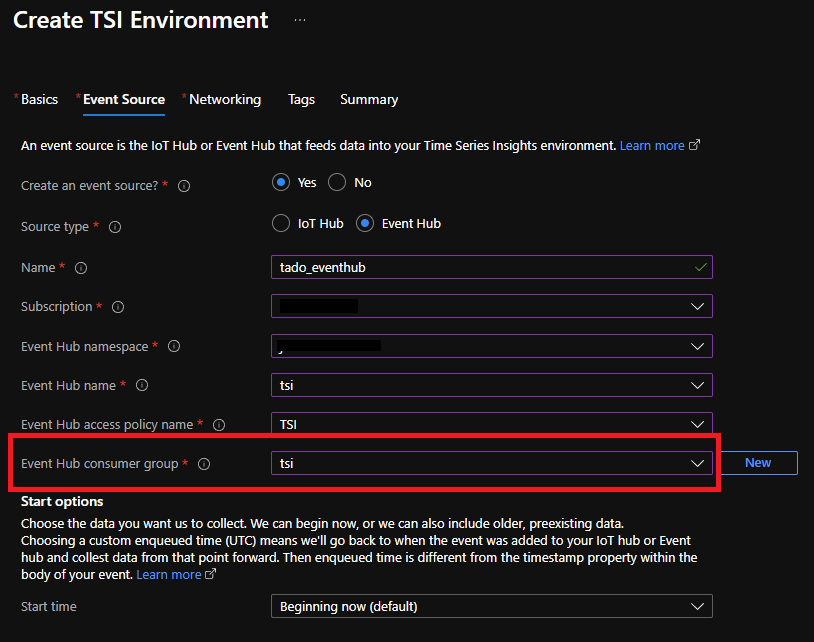
Time Series works with an Event Source, either a IoT Hub or an Event Hub – obviously in my case I have setup with an Event Source as the Event Hub configured earlier.
It turns out that the warning advising you on ‘A separate consumer group for each event source is required’ is really important! Initially I was finding that because I had chosen to use the ‘Basic’ tier which only allows for a single consumer group my Stream Analytics Job and the TSI Event Source were fighting which was causing inconsistencies in both services. Creating a dedicated consumer group for the TSI (you cannot use the Basic tier now) solved this straight away. Lesson learnt – read the warnings.
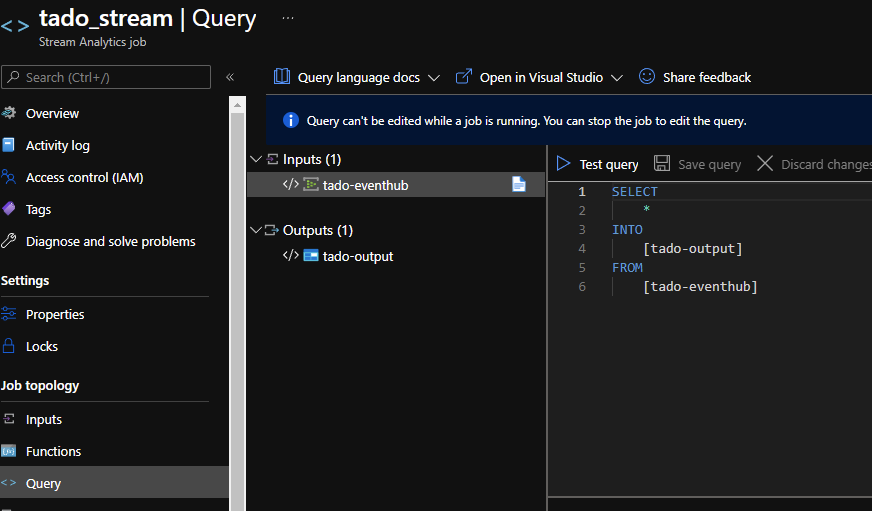
Stream Analytics Job
I wanted a way to write out the JSON to an Azure storage account (because, why not) for this I have setup an Azure Stream Analytics Job to take the output from the Event Hub and to pass everything onto the Azure Storage configured as an output.
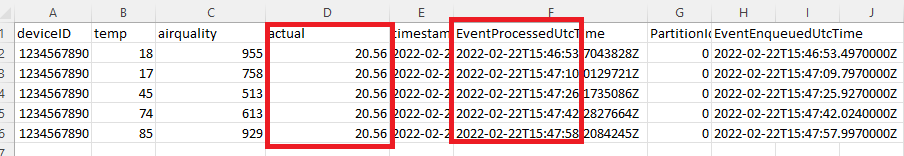
Within the Azure Storage Blob container, you will find a CSV file (we told the stream job to output as CSV). If you download the file, you can see the data being sent from the RaspberryPi to the EventHub.
You will notice the event is roughly every 15 seconds which is what we set the loop to earlier in the Python file. You will also notice the column ‘actual’ that is the data being pulled from the Tado API and the ‘fake’ data that we were generating for the TSI visualisation later in columns ‘airquality’ and ’temp.
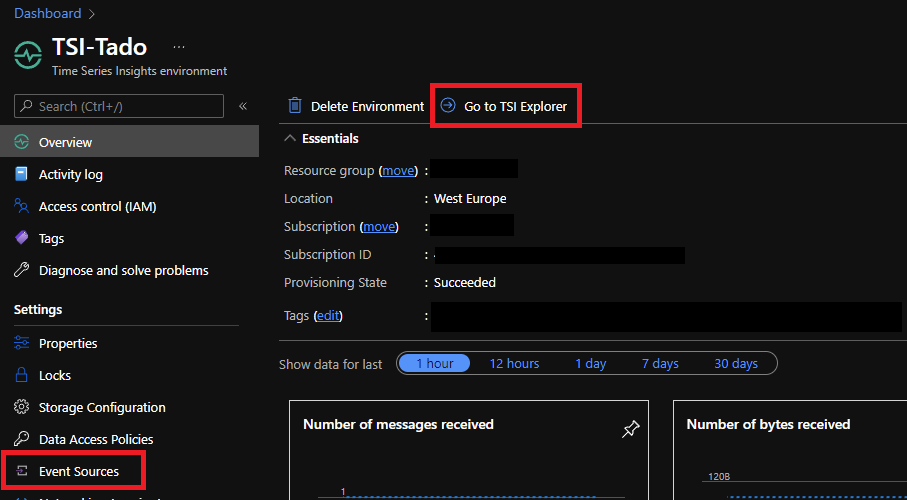
Viewing the data in TSI Explorer
TSI has a useful graphical visualisation tool - TSI Explorer. From the Time Series Insights environment Overview blade you can use the ‘Go to TSI Explorer’ to start viewing the data coming from the RaspberryPi.
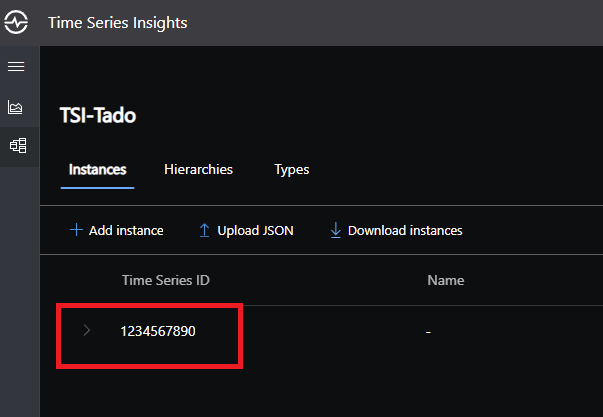
Device Instances
Once the Docker container us running it will start to send data to the Event Hub using the connection string and in turn TSI will use the Event Hub as its data source. You will notice that the RaspberryPi starts showing up as an instance ‘1234567890’ that’s because the property DeviceID with this value is being sent in the JSON.
Viewing the data
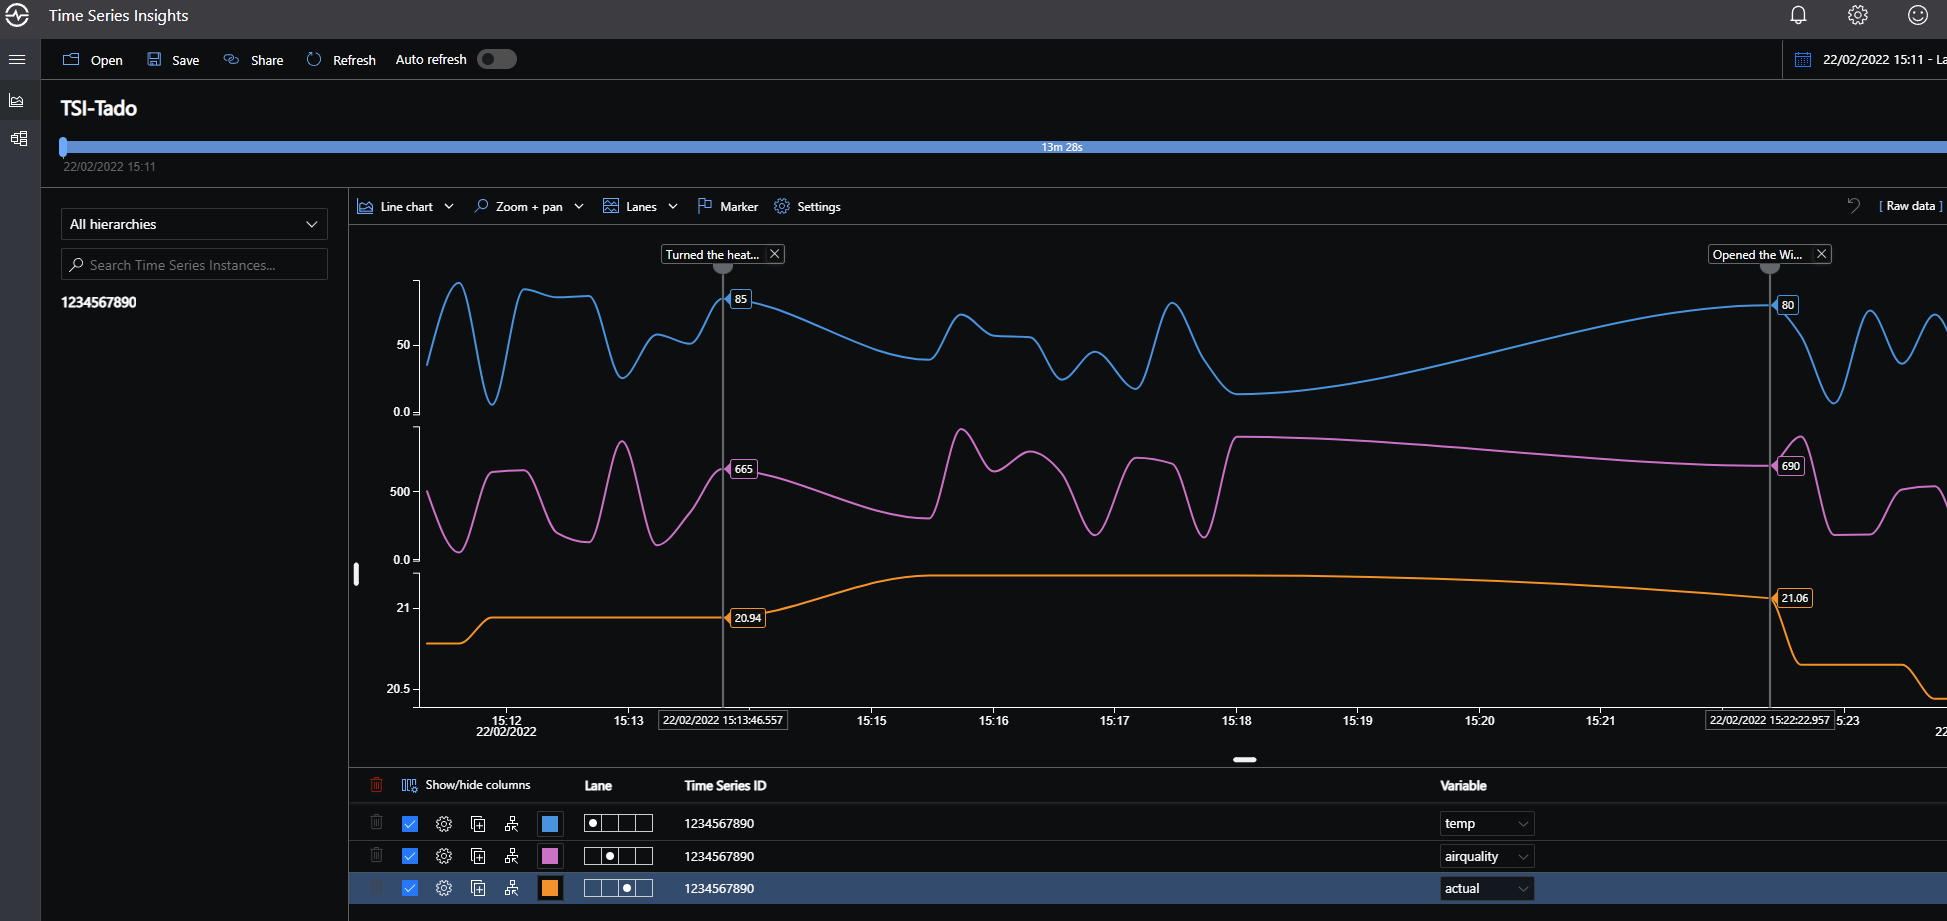
You can now see the data flowing from the RaspberryPi, through the EventHub and into TSI. The orange line in the line graph represents the data coming from the Tado API. The blue and pink lines are the ‘fake’ data we were generating to make the graph look a little more interesting with multiple data streams, and is useful to play around with the TSI swim lanes selected in the Time Series Well at the bottom of the explorer to see multiple streams of data on one visualisation.
The Explorer also allows you to add comments at important and interesting data points. You can see I have added a comment where I turned the heating up (you can see the orange line starts to climb) and when I opened the window (the orange line drops dramatically.)
As the temp and air quality are completely randomly generated numbers you can see they spike up and down far more dramatically.
And that’s it, a pointless project but a great way to have a play with a few interesting Azure services.